Chapter One: An Acoustics Primer
16. What is Loudness?
Loudness is the way in which we perceive amplitude. As mentioned above, a particular change in amplitude is not necessarily perceived as being a proportionate change in loudness. That is because our perception of loudness is influenced by both the frequency and timbre of a sound. The just noticeable difference, or JND for amplitude — that is, the minimal perceptible change in amplitude for a single tone— varies by the starting amplitude and frequency, but in general it ranges between 0.2 and 0.4 dB.
The most famous, well-used measurement for plotting our perception of loudness against the frequency of tones is the Fletcher-Munson curve(s) of equal loudness, published in 1933. The graphs were updated in 1956 by D.W. Robinson and R.S. Dadson. They were refined again in 2003 and adopted by the International Standards Organization as ISO 226, pictured below. The purpose of the graph is to show that for humans to consider two pitches equally loud, the amount of energy necessary to produce the tone at one frequency may be completely different for another. The multiple lines, spaced in 10 dB SPL increments at 1 kHz (called phons), also show that the energy/frequency differences are steeper at lower intensity levels and flatten out at extremely high intensities, though not quite as much as Fletcher and Munson first determined.
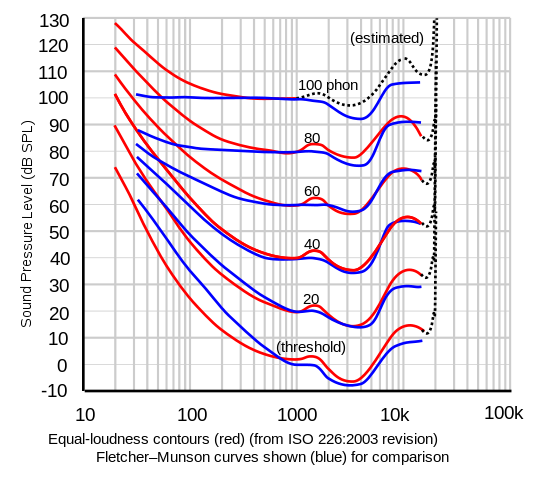
The "loudness button" on a stereo amplifier is intended to boost bass frequencies at lower volume levels where the curve is the steepest. In viewing the graph, it immediately becomes apparent that much more acoustic energy is required in the lower frequencies to create sounds of equal loudness to those in higher frequencies. For example, following the curve labeled 40 phons, in order to sound equally loud to a 1,000 Hz tone of 40 dB SPL, a tone of 20 Hz would need to be 100 dB SPL, 60 dB greater, or approximately 1,000 times the amplitude of the 1,000 Hz tone. With a minimum for all the curves around 4000 Hz, some additional energy is also required for equal loudness at higher frequencies. You do not buy a 500 watt amplifier for frequencies in the 5000 kHz range, but you might for equally loud bass in the 20-100 Hz range.
Most natural and instrumental sounds have the majority of their acoustic energy in the lower portion of their spectra—this naturally follows the way we hear. Certain synthesis methods, such as frequency modulation (FM) and white noise generation are prone to creating energy equally distributed across the spectrum, and so to us, they sound weighted toward the higher end of the frequency spectrum.
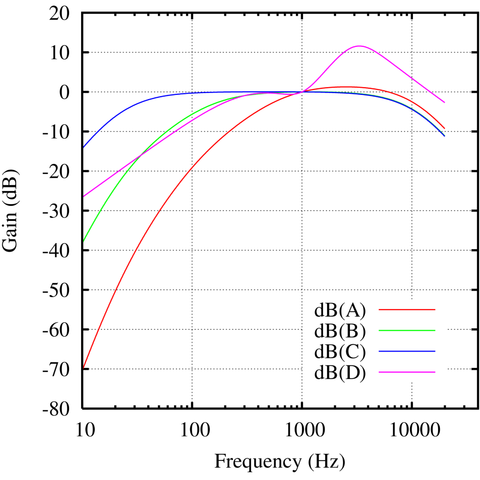
Above, there was mention of weighted methods of dB measurement that were more closely related to the way in which we hear. The most widely used is the ‘A’-weighted or dBA scale, which rolls off, or progressively filters out lower frequencies and so creates a measurement in which all audible frequencies are measured for equal perceived loudness at SPL's of approximately 40 dB. This is a standard option on most dB meters and measurements should be indicated as dBA, not dB. The dBA curve is indicated in red on the graph below. Interestingly, the dBA scale was based on the Fletcher-Munson 40 dB curve, which turned out to be the closest to the ISO 226 curve (pictured above) and is therefore best used for soft to moderate sound levels, but not high levels. The other commonly used curve for human-hearing-weighted measurement is C-weighted, or dBC, pictured in blue below in blue. This is most useful for measurements at higher amplitudes because of the way it flattens out for several octaves, as does the corresponding higher-amplitude Fletcher-Munson curves. Think of these curves as the inverse of the Fletcher-Munson curves, so they are equalizing amplitudes to the way we actually hear. dBB, and dBD are rarely used anymore, and dBZ is more or less flat with a variable low rolloff and also rarely seen.
Masking:
Masking, as the name implies, occurs when one sound affects the perception of another sound, either partially or totally eclipsing our awareness of it. There are several different types of masking that have been studied, pioneered again by Harvey Fletcher. For simultaneous sounds of widely different frequencies or complexities, a simple amplitude difference may mask the softer one. For example, the broadband noise of a vacuum cleaner (called the masker) may mask the dialog of the TV show (called the signal) you are trying to watch. When you turn up the TV volume to reach a point you can hear the dialogue, you have arrive at the masked threshold. We had seen earlier that lower frequencies more easily mask higher frequencies on the basilar membrane, but the complete picture also involves amplitude. Masking occurs when the neurons of the basilar membrane fatigue, and sensitivity to a particular frequency in the critical band of the neurons decreases. The amplitude difference necessary to create masking depends on the frequency difference. The strongest masking response occurs with tones within the same critical band, where the least difference in intensity is required. It is also possible for sounds which are not simultaneous to exhibit masking, if the first tone is sufficiently loud and the subsequent tone occurs within a time span short enough for the neurons to stay fatigued. An extreme example of this might be how many bars of the 1812 Overture you miss following the nearby cannon blast. In such extreme exposure, non-simultaneous masking may in reality last more than a day. Masking is yet one more psychoacoustic phenomenon a composer can take advantage of, and is already exploited by perceptual audio coding, such as mp3's, where bandwidth is saved by eliminating masked frequencies which would not be heard in the first place (in theory).
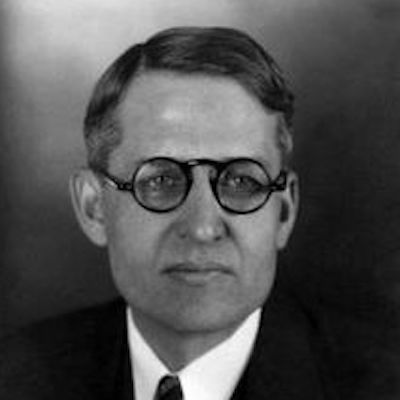
Harvey Fletcher
Physicist Harvey Fletcher (1884-1981) determined our perception of loudness depends not only on amplitude, but varies with the frequency of the sound, codified in famous contours he developed with Wildon Munson known as the Fletcher-Munson Equal Loudness curves. He was an early researcher of speech perception and the critical band mentioned above. He also developed early stereo recording techniques, the first electronic hearing aids, and noise measurement meters as he worked on urban noise abatement.
