Chapter One: An Acoustics Primer
8. What are wave shapes and spectral content? | Page 3
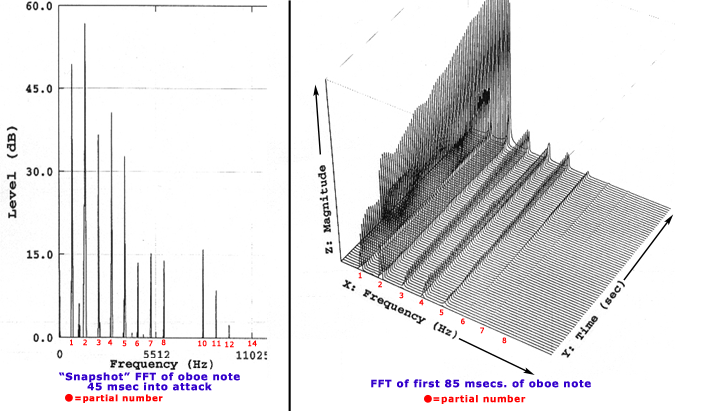
Early on, researchers were able to quickly visualize real-world sound in two important ways—either by taking a snapshot of the instantaneous amplitudes of a sound’s component frequencies at a single given point in time (called an FFT or Fast Fourier Transform) or by creating a sequential series of snapshots to give a picture of how a particular sound's spectral components evolve over time. This form of FFT gives tremendous insight into how the various partials of an instrument evolve in the first few milliseconds of its attack.
Pictured below are two FFT's. The figure on the left plots the frequencies and strengths of an instantaneous moment of an oboe note in two dimensions. The second analysis on the right demonstrates the attack phase of an oboe note in 3 dimensions: frequency, amplitude, plus time. This is sometimes referred to as a waterfall plot. It can be viewed as a collection of sequential snapshots of the analysis on the right, offset and overlapped to show how the note spectrally evolves.
The plots above were made using a 1st-generation NeXT "Cube" computer in the late 1980's, with the plot on the right being rotatable in 3D space.
Notice in the left 'snapshot' FFT, the 2nd partial has a greater amplitude than the fundamental and also that partials #9 and #13 are missing from the spectrum. Notice in the right waterfall FTT how the various partials develop over time and change strength relationships.
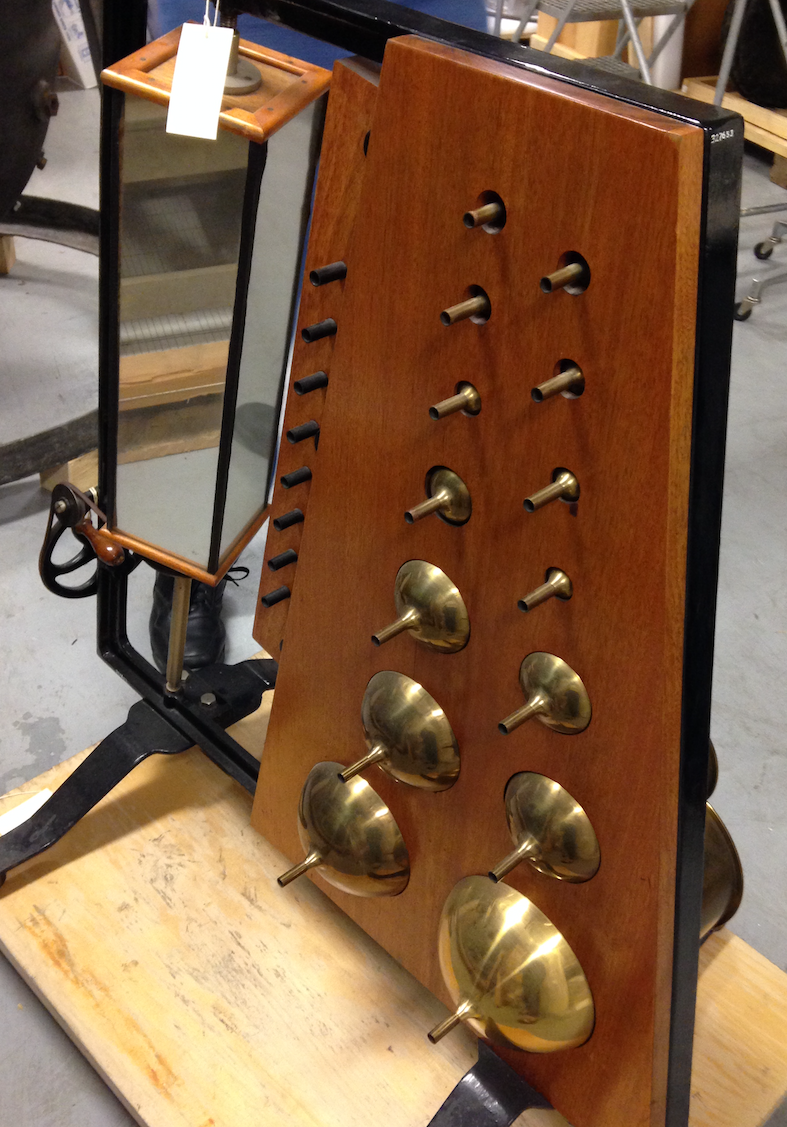
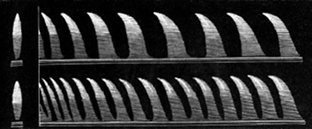
19th Century Old-Skool Spectral Analyzer
Rudolph Koenig (1832-1901), who worked with Helmholtz on various sound-analyzing apparatus, developed a flame manometer, pictured on the left (photo: Jeffrey Hass). A series of resonators were attached to a source of gas (tubes missing in photo) and lit ablaze while the operator rotated the mirror to project an image on a wall. The frequencies most present in the sound being analyzed emitted greater pressure on the gas due to the enhancing action of the resonators, and therefore a crude picture of the spectral frequencies was visible on the wall as predicted by the image below (from Wikipedia Commons).