Chapter Four: Synthesis
2. Synthesis Waveforms | Page 2
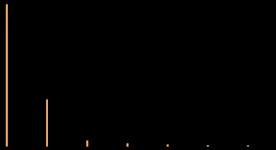
A different way to look at waveforms is to view a graph of their spectra (pl. of spectrum). Below are graphs of the partials and their relative strength for the same waveforms on the previous page. Illustrations like these are known as spectrographs.
Mobile users, swipe tables sideways| Waveform | Shape/Sound click image to play/pause |
Spectrograph | Spectrum / Strength |
|---|---|---|---|
| sine wave |

|
 |
fundamental only n/a |
| triangle wave |
 |
 |
odd partials only 1/p#2 |
| sawtooth wave |
 |
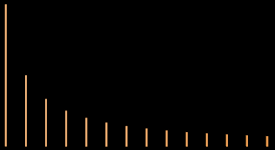 |
all partials 1/p# |
| pulse wave 1:3 duty cycle (missing every 3rd partial) |
 |
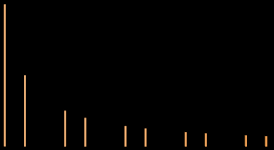 |
Determined by duty cycle 1/p# |
If you summed sine waves at the exact relative frequencies and amplitudes shown above for the non-sine forms, you would recreate these waveforms listed through additive synthesis—the more partials you added, the closer to the actual forms you would come (see Waveshape 2). This is sometimes called Fourier synthesis, after Jean Baptiste Fourier (1768-1830), who postulated that complex waveforms could be broken down to their constituent sine waves. To analyze more complex waveforms, FFT's or Fast Fourier Transforms are used. While the math involved in such analyses may be daunting to some, most current audio programs provide instant graphic analysis. If you are somewhat math-challenged, but still interested in pursuing these further, both Curtis Roads: The Computer Music Tutorial and Gareth Loy: Musimathics have supplemental tutorials for the math involved.
