Chapter Four: Synthesis
13. Speech Synthesis and the Channel Vocoder | Page 3
How the Channel Vocoder Works
Homer Dudley's Vocoder Schematic
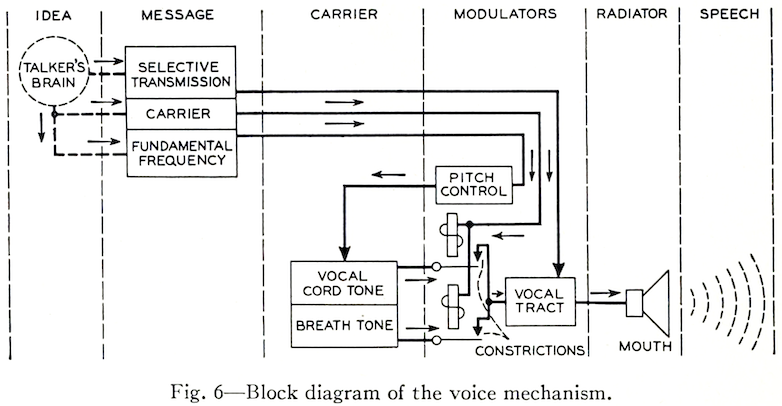
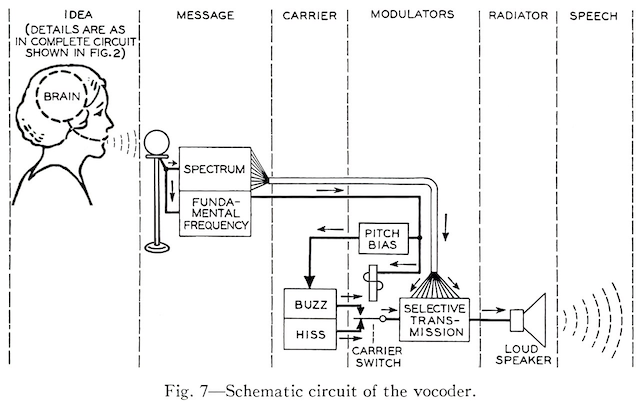
These schematic diagrams are from Homer Dudley's 1940 article "The Carrier Nature of Speech". Bell System Technical Journal, XIX(4);495-515. Fig. 6 encapsulates his deconstruction of human speech into an acoustic carrier/modulator model. Fig. 7 demonstrates how he translated that model into the electronic circuitry of the vocoder. Below we will see how selective transmission is implemented.
The Vocoder Analysis Phase
A traditional channel vocoder encompasses two phases, an input/analysis phase and a resynthesis phase. Speech or some other modulated signal, either live or prerecorded, is passed into a parallel bank of bandpass filters for the analysis phase, as the diagram below indicates.
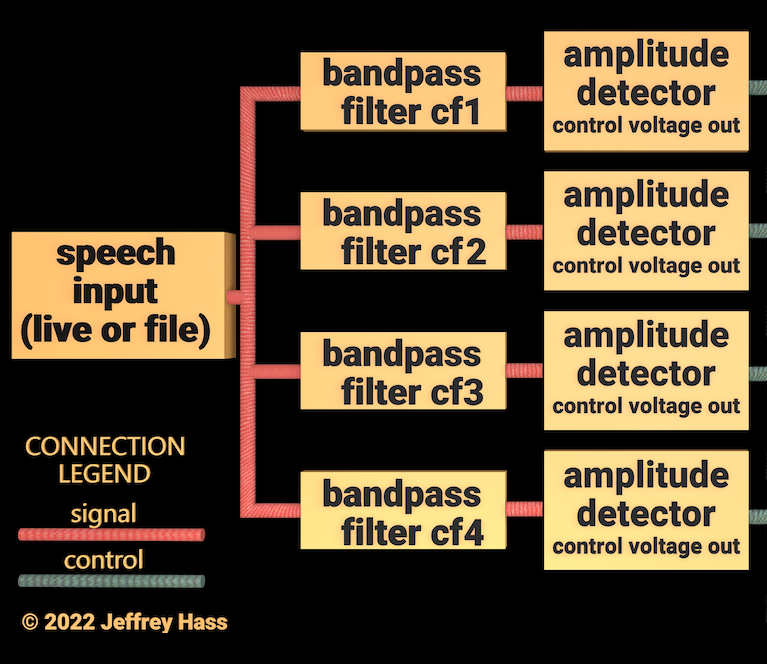
While the diagram is simplified, the number of analysis filters or channels in practice ranged from between eight and twenty-four tuned successively from low frequency to high. These filters selectively reduce the input signal’s full audio spectrum to a fraction of its original bandwidth. The center frequencies of these filters typically ladder through the human speech spectrum (cf1, cf2, etc. above). Dudley used ten bands 300 Hz apart, from 0 Hz to 2,950 Hz (with the lowest band being only 0-250 Hz). The 1979 Moog Vocoder uses sixteen bands from 50 Hz to 5080 Hz , with increasing exponential spacing. While more filter bands and a wider spectrum would lead to a more accurate reconstitution of speech, the actual “classic” effect most creative users are after normally limits the number of bands (aka “channels”) to sixteen or fewer. For telephonic or other technical signals applications, the guiding principle to conserve bandwidth was how few bands are “just good enough” to pass intelligible speech data. In addition to the number of analysis bands, the bandwidth (filter Q) and sequential tuning of the bands has a significant impact on the output character and quality. The audio output of each filter channel is then passed into its own amplitude detector.
Channelized Amplitude Detection
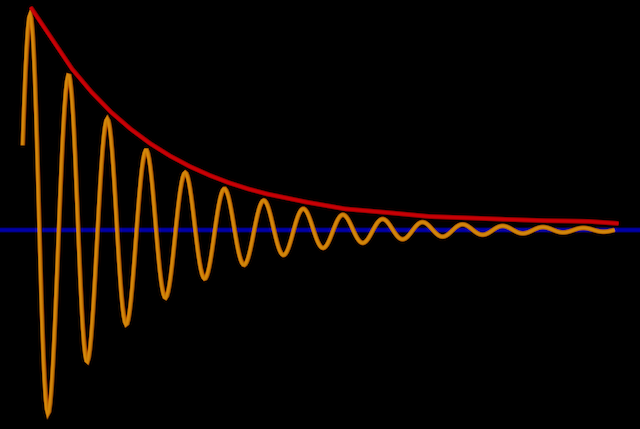
The brilliance in Dudley’s design was that the now-decimated and channelized audio coming out of the filter bank is not passed directly to the audio output. The magnitude or amplitude of the signal stream making it through each filter is measured by an amplitude detector, which outputs a corresponding time-varying control voltage stream for each band. The detected stream is pictured in red on the left. This is equivalent to the peak deviation discussed in the Acoustics chapter.
The streams of amplitude control data voltage are then passed to the resynthesis stage, discussed on the following page. The control voltage streams vary at a much lower speed than the modulated audio input (see Dudley's graph at bottom of page), which made transmission of the vocoder's analysis phase of great interest to telephone companies of the time. In an early modification to the original vocoder, the analysis control signal was updated only 50 times per second via early sampling technology to still produce understandable speech when transmitted to a receiving resynthesis unit. For modern vocoder digital FFT analysis, phase information is discarded.
Early Vocoder Amplitude Detection Circuit
The amplitude detector was originally a simple rectifier/lowpass filter pair to demodulate the input signal. The rectifier, either half wave (which discards negative current) or full wave (which inverts negative current) converted the AC bipolar (+/-) filter output into a unipolar (+ only) pulsed stream, which the lowpass filter attempted to smooth out. Subsequently, less jittery solid-state envelope followers were developed for this purpose. Pre-filtered digital amplitude followers are still in use today for audio applications such as compressors. If you are a Max user, the avg~ object functions as a simple amplitude detector. These days, a digital vocoder plug-in is most likely to use selective bands from an FFT analysis to replace the entire filter bank/amplitude follower structure, discarding the phase data while passing on the magnitude of the selected bands.
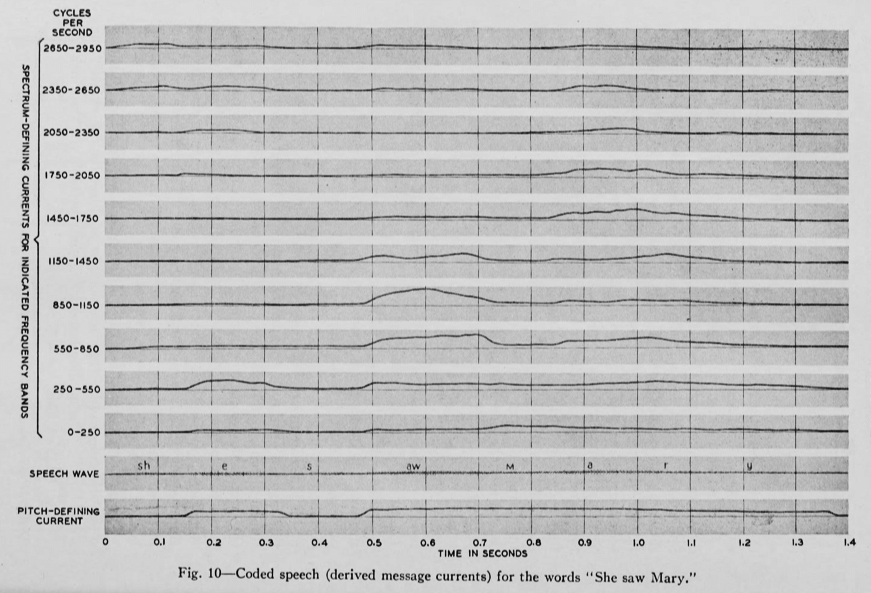
The image below from Dudley graphs the ten amplitude detection streams, plus pitch tracking for the spoken phrase "She saw Mary."